Yes, dental CE can generate a measurable, positive return, but only when you treat it as a capital investment rather than a credential requirement. Before you register for anything, run three checks: calculate the full total cost of attendance, verify the target procedure’s case economics at your practice, and set a realistic adoption timeline. Clinical skills training typically pays back within 6 to 12 months; case-acceptance and practice management courses often move faster.
How to Calculate Return on Investment Dental CE Programs Actually Deliver
Every return on investment dental CE calculation starts with an honest number for what the course really costs, and most practice owners underestimate it badly. Tuition is the number on the course page. Total cost of attendance is what actually leaves your bank account and your schedule.
Start with direct costs: tuition, required materials, and consumables you’ll burn through in hands-on sessions. Add travel and lodging for in-person programs. Live-surgery and hands-on formats justify the airfare because you cannot learn suturing technique through a screen. Purely didactic content doesn’t need a flight, which is one reason online lecture formats keep total cost of attendance lower for foundational topics.
The part most spreadsheets miss is opportunity cost. A dentist out of the chair for two clinical days isn’t just skipping a course, they’re skipping production. Practices that ignore lost production routinely find their real total cost of attendance runs several times higher than the advertised tuition once you account for time away from the operatory.
Build your total cost of attendance from these line items:
- Tuition and course materials
- Travel, lodging, and meals (in-person only)
- Lost production for the doctor and any staff attending
- Locum or associate coverage, if you hire it
- New equipment, software, or supply inventory needed to deliver the service
- Marketing spend to launch or announce the new procedure to your patient base
That last item surprises people. Learning to place implants does nothing for your bank account if patients don’t know you offer it.
Project Revenue Impact Using a Three-Scenario Framework
Before you can project anything, pull your baseline numbers: current monthly case volume for the target procedure, average fee per case, and contribution margin after lab and material costs. Without a baseline, every projection afterward is a guess dressed up as math.
From there, build three scenarios rather than one number. Here’s the sequence that works:
- Set your adoption curve. Assume near-zero case volume in month one, partial ramp through months two and four, and steady-state volume by month five or six for most surgical skills. Case-acceptance or practice-management training often ramps faster, sometimes within weeks.
- Estimate steady-state monthly volume. Base this on your existing patient pool, referral pipeline, and how many patients present as candidates for the new service each month.
- Model the acceptance-rate lift separately. If the course teaches case presentation alongside a clinical skill, factor in both a volume increase and an acceptance-rate increase. Practices that track outcomes on presentation skills report acceptance rate gains of roughly 23% or more when the whole team is trained, not just the doctor.
- Run conservative, base, and aggressive versions. Conservative assumes half your expected adoption rate and a longer ramp. Base uses your honest middle estimate. Aggressive assumes strong referral response and full team buy-in.
Always lead with the conservative scenario when deciding whether to enroll. If a course only pencils out under the aggressive case, it’s a bad bet.
Pro Tip: Run the conservative scenario using last year’s slowest quarter as your baseline, not your best month. If the math still works during a slow season, you have a genuinely resilient investment.
Worked Example: ROI Percentage and Payback Period
Here’s a simplified example for a general dentist adding single-tooth implant placement, using the ROI formula: (Incremental 12-month profit minus total cost of attendance) divided by total cost of attendance, times 100. That formula, and a version of this worked example, comes from CE Crowd’s ROI analysis.
Change anyone variable, average case fee, adoption speed, lab costs, and the payback period moves. That sensitivity is exactly why you model three scenarios instead of trusting a single number.
Compare CE to Other Practice Investments
CE competes with equipment purchases, marketing spend, and new hires for the same dollars, and it usually wins on speed of return when it adds a billable, high-margin service.
- Equipment (a CBCT unit, a new laser) often carries payback periods of 18 to 36 months and depends entirely on utilization you have to build.
- Marketing spend can produce fast new-patient volume but rarely improves your case mix or margin per procedure on its own.
- Hiring (an associate or hygienist) has the longest ramp, often 6 to 12 months to full productivity, and carries payroll risk regardless of case volume.
- Implementation-focused CE that adds a new billable procedure or lifts case acceptance frequently beats all three on speed, because you’re monetizing chair time you already have.
That said, CE isn’t automatically the smarter allocation. If your operatories are already at capacity, a new hire may free up more revenue than another skill you can’t schedule time to use. If your case-acceptance rate is fine but patient volume is low, marketing may outperform another course.
Implementation Playbook: Team Integration and a 90-Day Rollout
A course only produces revenue once your team can sell it, schedule it, and deliver it consistently. Bring your treatment coordinator or front-desk lead to relevant courses, not just clinical staff, and assign a single owner for rollout so accountability doesn’t disappear into “everyone’s job.”
A 90-day window gives you the fastest honest read on whether adoption is on track. Structure it like this:
- Weeks 1 to 2: Update scheduling templates, build patient-facing materials (before/after cases, consult scripts), and brief the whole team on the new offering.
- Weeks 3 to 6: Run role-play on case presentation. Consistency in how the team talks about the procedure moves acceptance rates more than almost anything else.
- Weeks 7 to 12: Hold weekly KPI reviews, tracking consults booked, cases presented, and cases accepted against your baseline.
- Ongoing: Schedule mentoring or live-surgery follow-up sessions for complex cases before your confidence outpaces your experience.
Pro Tip: Assign one team member to log every patient who was a candidate for the new procedure but declined it, along with the reason. That log tells you whether your problem is presentation, price, or timing, and each one has a different fix.
Programs built around structured protocols and team training rather than lecture alone consistently show faster integration into daily practice.
Measurement Framework and KPIs to Track Post-Course
You can’t attribute revenue to a course you never measured against. Set your baseline the week before you attend: case volume by procedure, average fee, contribution margin, and chair time required per case.
Then track leading indicators weekly, because they move before revenue does:
- Number of patients presented as candidates
- Consults booked for the new procedure
- Case acceptance rate
- Cases actually completed and their average fee
Multiply completed cases by margin per case, subtract any added overhead, and you have your monthly incremental profit. Compare cumulative incremental profit to your total cost of attendance to know exactly where you stand on payback.
Reforecast your model at the 90-day mark and again at 6 months. Practices that document assumptions upfront and track outcomes weekly for the first 90 days catch adoption problems early enough to fix them, instead of discovering a stalled rollout at the annual review.
One number worth anchoring on: implementation-focused CE programs, ones built around protocols and team training rather than passive lecture, can produce measurable revenue increases within 90 days to 18 months, depending on the complexity of the skill.
Lecture-only CE hands you information. Mentorship-driven CE hands you a corrected technique in real time, and that difference shows up directly in your adoption curve. When a live-surgery module lets an experienced clinician catch a flawed suture pattern or a poorly angled implant osteotomy before it becomes a habit, you skip months of trial-and-error that would otherwise show up as lower case acceptance or redone work.
Tiered learning paths matter for the same reason. Jumping straight into advanced grafting without foundational placement experience tends to inflate both your ramp time and your risk of complications, which is expensive in ways that never appear on a tuition invoice.
Structured, mentorship-supported training reduces the gap between watching a technique and safely performing it, which is precisely the gap that determines how fast a new skill turns into billable cases.
Long-Term Career Benefits That Don’t Show Up in Month One
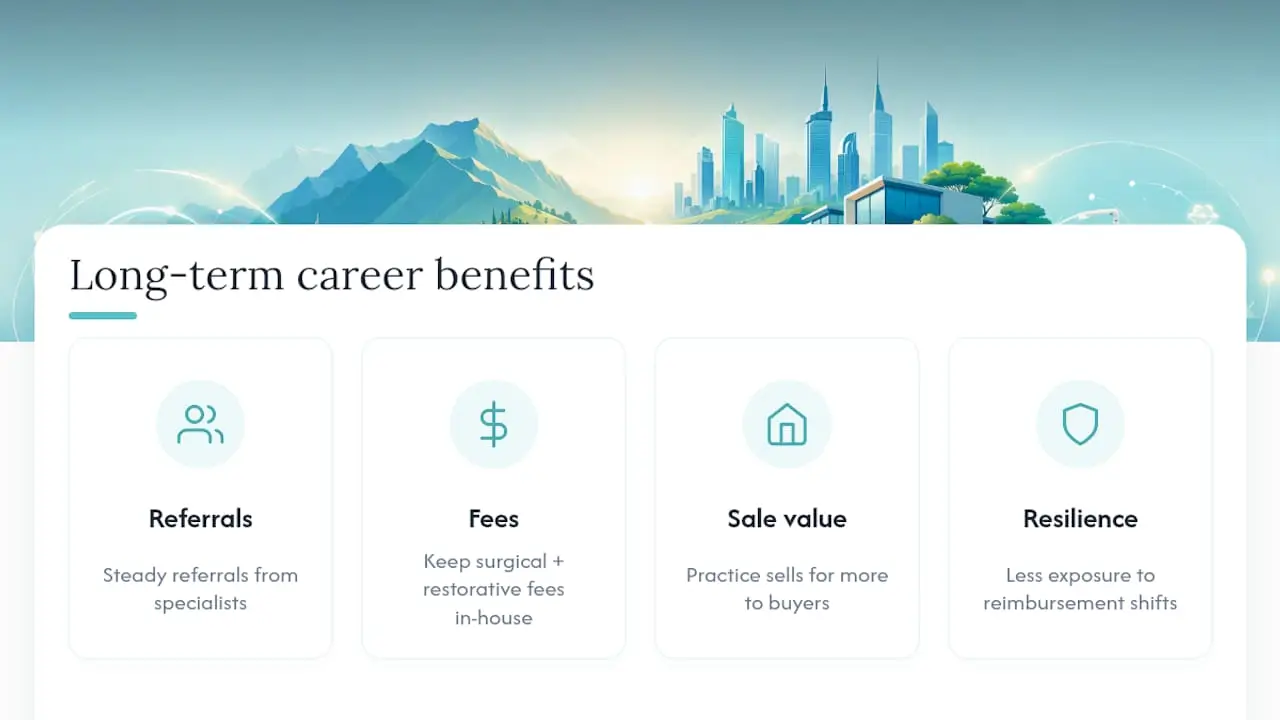
Not every return from CE shows up in next quarter’s revenue report, and treating CE purely as a short-term profit lever undersells its real value. A dentist who systematically builds surgical competency over several years develops referral relationships with specialists, a reputation that reduces marketing spend over time, and the confidence to handle complex cases in-house instead of referring them out.
That referral retention alone can be worth more than any single procedure’s margin. A general dentist who keeps implant cases in-house rather than sending them to an oral surgeon captures both the surgical fee and the restorative fee, and that case stays in your patient’s chart instead of a specialist’s.
There’s also a compounding effect on practice value. A practice with documented capability across implants, aligners, and surgical procedures is worth more to a buyer than a practice reliant on referrals for anything beyond basic restorative work, because the acquiring dentist inherits a broader revenue base on day one.
Career resilience matters too. Dentists who diversify their skill set across multiple high-margin procedures aren’t as exposed when insurance reimbursement shifts or one service line softens. None of this shows up in a 12-month ROI calculation, but it belongs in your decision anyway, especially for CE investments you’re weighing as much for the next decade of your career as for next quarter’s numbers.
Risk Factors and Uncertainties Affecting ROI From Dental CE
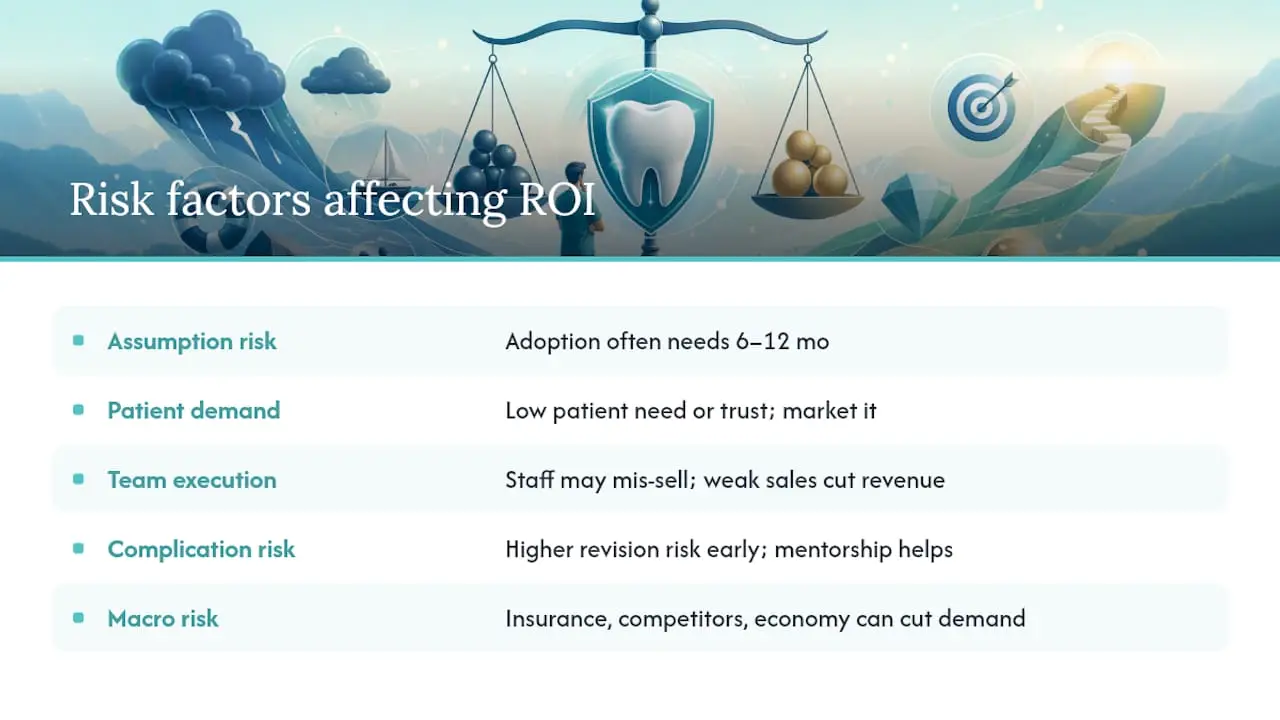
The biggest risk isn’t the course, it’s the assumptions underneath your model. Overestimating adoption speed is the most common error. Clinical skills investments typically need a 6 to 12 month ramp for full profitability, and expecting a return inside 30 days is a near-guaranteed way to conclude a genuinely good course “didn’t work.”
Patient demand risk is separate and just as real. You can master a technique perfectly and still see slow case volume if your existing patient base doesn’t need that procedure or doesn’t trust you yet to deliver it, which is why the marketing line item in your total cost of attendance isn’t optional.
Team execution risk shows up when the doctor learns the skill but the front desk can’t explain it, or the treatment coordinator undersells it in consultation. A brilliant clinical outcome tied to a weak sales conversation still produces disappointing revenue.
There’s also complication risk with any new surgical skill. Early cases carry a higher chance of revision or referral-out, which quietly erodes margin during the ramp period, another reason mentorship access during your first cases matters financially, not just clinically.
Finally, watch macro risk: insurance reimbursement changes, local competition adding the same service, or a slower-than-expected local economy can all suppress the demand side of your model regardless of how well you execute. Building your projections on the conservative scenario protects you against most of these without requiring you to predict any of them precisely.
Financing and Payment Options and Their Effect on Net ROI
How you pay for CE changes your net return, sometimes significantly, because financing costs and tax treatment both move the denominator in your ROI formula.
Paying cash upfront keeps things simple and avoids interest, but it ties up capital you might otherwise use for equipment or marketing that could produce a faster return. Course financing or payment plans spread the total cost of attendance over several months, which improves short-term cash flow but adds interest that reduces your net ROI slightly, worth modeling explicitly rather than ignoring.
Many CE expenses, tuition, travel, and materials among them, are typically deductible as ordinary business expenses, which can meaningfully improve your after-tax return. Because deductibility rules depend on your entity structure and circumstances, confirm specifics with your accountant before you count on a tax benefit in your model.
Employer or practice-sponsored CE, common in group practices and DSOs, shifts total cost of attendance off the individual dentist’s books entirely, which changes the ROI calculation from a personal one to a practice-level one. If you’re weighing whether to have the practice pay versus paying personally, that decision affects both your net ROI and how the deduction flows, another reason to loop in your accountant before committing.
Why the Payback Clock Matters More Than the Credit Count
Set clear objectives, an owner, and specific KPIs before you register, the same discipline you’d apply to any other capital purchase. Most practice owners treat CE spending as separate from “real” investment decisions, and that’s the mistake. It isn’t separate. Money spent on a course that never gets implemented is capital with a payback period of never. Model conservatively, especially for complex surgical skills, and resist the urge to expect returns inside 30 days. That patience is what separates CE that pays for itself from CE that just adds letters after your name.
— Jake
Choosing Hands-On, Mentorship-Based CE to Shorten Your Payback Period
Everything in the framework above depends on one variable you can actually control: how fast a course gets you from classroom to confident, billable execution. That’s the gap One World Dental is built to close. Some courses pair tiered learning paths, foundational through advanced, with mentorship and live-surgery modules, so you’re practicing the technique under supervision rather than guessing your way through your first ten cases alone.
If your worked ROI model points toward adding surgical implant placement, courses like From Extraction to Implant: The Complete Surgical Workflow map directly onto the revenue scenarios covered here, at $795 for the full surgical workflow. Want to test the water with a lower-cost, no-travel option first? The Introduction to Dental Implants online lecture series runs $549 and builds the foundational knowledge your adoption curve depends on before you commit to a hands-on seat. For grafting and suturing skills that round out an implant service line, check the implant surgery course catalog. Run your own conservative scenario first, then pick the course page that matches the procedure your numbers support.
Recommended